The Real Estate Market in Atlanta is Improving
Posted on June 25, 2012 byThe good news for the Atlanta Real estate Market is that 2012 year to date sales rose over 17.1% in 2011 and 23.3 % over 2010. Sales gains in 1Q and 2Q 2011 were even more significant since they were being compared to 2 periods in 2010 which were boosted by government tax incentive purchases, making the 1Q 2012 increase above those gains even more significant (Chart 1).

Chart 1
A lot of this has to do with the drastic increase in the quantity of sales since 1 Q 2011 and especially since 3rd quarter 2011. And, while the number sold increased, 42% of the sales were under $100,000 and 70% of the sales were under $200,000 (Chart 2).

Chart 2
While sales have increased during 2012, the number of Active Listings in Atlanta are at a 12 year low. The number of distressed property Active Listings has remained near the same level since the market shifted. But, with less listings inventory, the percentage of Total Sales that are distressed dramatically increased. In fact, over 42% of 1 Q 2012 sales are distressed (Chart 3).
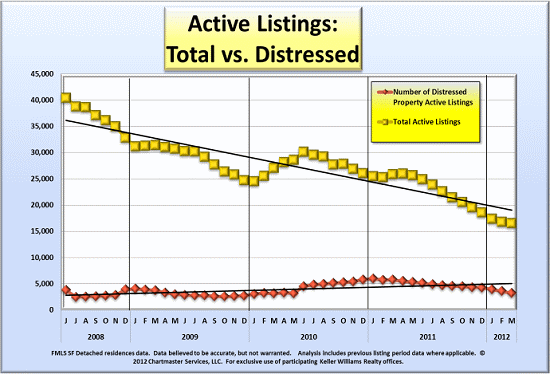
Chart 3
With 70 % of the sales under $200K and a balanced market having 6-7 months of inventory, the increase in investors for this price range because of high rental capitalization rates, has shifted the under $200K market to be a Seller’s market. Properties less than $100K are experiencing multiple offers well over the list price (Chart 4).
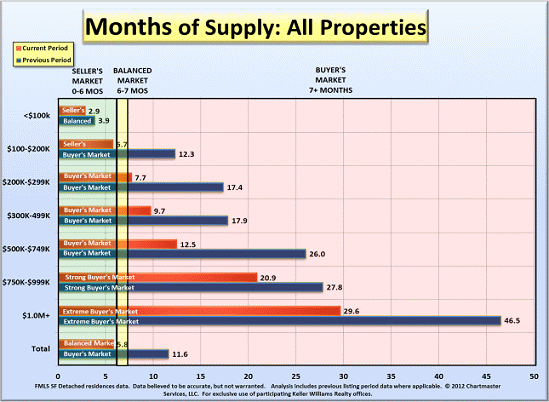
Chart 4
The overall percentage of foreclosures was lower in 1Q 2012 than in the same period in 2011 where the decrease was most noticeable in the
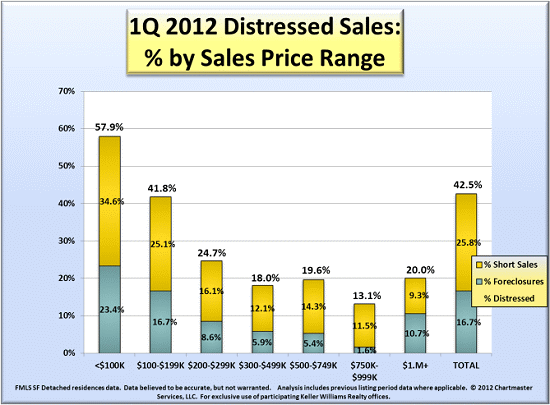
Chart 5
Additionally, monthly sales history shows the pattern of sales downturn since 2007 illustrating the bottom of the market occurred in January of 2010. Since then, the usual seasonal low points in January have been higher in both 2011 and 2012, possibly indicating a base for continued sales growth (Chart 6).
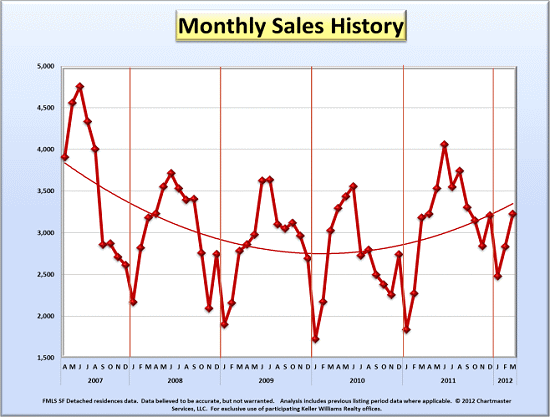
Chart 6
In reviewing the market from last year to this year, segmenting the sales by New vs. Resale and separating the price ranges shows that the increases came from the lower price segments in both New and Resale properties, while declines in the market occurred in the higher price ranges. The market from years early years of 2007 to early 2010 revealed a totally pink chart indicating that all markets were worse than the previous quarter or year. The fact that the charts for the last several quarters are turning mostly green is a great sign that the real estate markets in Atlanta are improving (Chart 7).
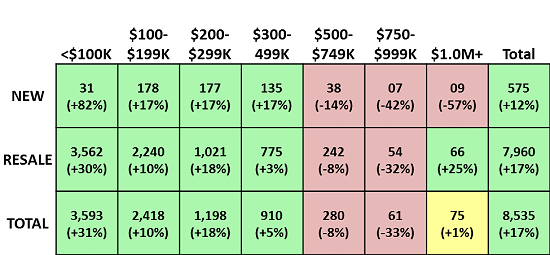
Chart 7
What does this mean for Investors? Low-ball offers on high-value properties may result in missing out on a great opportunity. Prices are still low, but will most probably be rising (prices are already rising in many markets of North Atlanta). The quantity of distressed properties is still quite high and afford opportunity for those looking to acquire great deals for rental or flipping. Although cap rates on most rentals are above 10% for properties under $200K, cap rates are declining with the competitive nature of multiple offers causing prices to increase. As a matter of fact, over 17% of sales are over list price last quarter and that number is rising. Quick action and serious offers are required when high-value properties are found, since low number of days on market and a high Sales Price to List Price ratios are the result with multiple offer situations.
In summary, cheap properties, low interest rates, and high cap rates make this the most opportune time in our history to be buying real estate. Don’t miss out on the greatest time to be building great wealth in Real Estate.
(This statistical market data and charts are provided exclusively to Keller William Realty-Rawls Group by Chuck Carr of Chartmaster Services, LLC. which cannot and does not warrant the accuracy or completeness of the data. The source of all data contained herein is FMLS listings data for real estate transactions occurring in 41 FMLS areas including Fulton, Dekalb, Cobb, Gwinnett, Forsyth, Cherokee Douglas, and Paulding counties, and does not necessarily represent all market activity either for those areas or for the Atlanta Metro area).

Hello Deboarh, Yeah Atlanta is improving obviously. chart – 7 is good for the investors and even buyers to know the current situation over there. Other charts also mentioning details professionally.