The Atlanta Real Estate Market Stats By Area
Posted on April 4, 2016 byAtlanta, Georgia was one of the big real estate stories of 2015 and is #5 of the top 10 markets to watch according to Realtor.com. Home prices in the metro area rose by double digits over the last couple of years, outpacing most of the nation and are finally above their 2007 high prices. Although home-prices and appreciation has leveled off to some degree, continued gains are expected in 2016. Let’s look at this growth by area (Figure 1). For the purposes of this article, we are talking about single family detached in these areas.
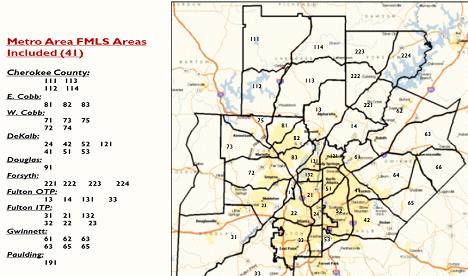
Figure 1: Atlanta Metro FMLS Areas
Below is a chart depicting the number sold (Figure 2). Sales are really rapid in Gwinnett (60- 66) and surprisingly Paulding (191). One must take into consideration the size of the area in looking at these numbers as well. Vinings (71) is a geographically small area with very expensive houses resulting in a tiny number sold.
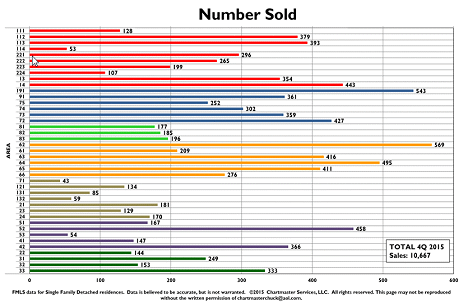
Figure 2: Number of Houses Sold per FMLS Area
Now let’s look at the change in the number sold (Figure 3). The straight red vertical line represents the median. This really depicts how tight the market is. Buckhead (21), Midtown (23), Brookhaven (51) and Sandy Springs inside the Perimeter (132) are pricey areas with little on the market. East Cobb (81, 82) markets are narrow due to school systems being highly desirable.
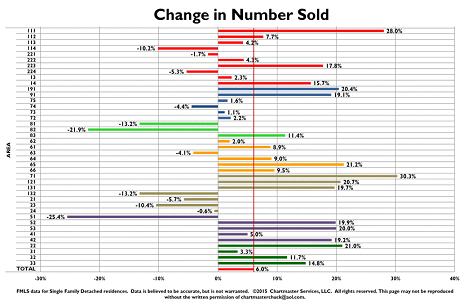
Figure 3: Change in Number of Houses Sold per FMLS Area
Distressed sales are a combination of foreclosures and short sales (See Figure 4). The median for these Atlanta areas is 8.8% South Dekalb (41, 42, 52, 53), South Fulton (31, 32, 33) and Douglas (91) counties are plagued with distress sales the most. Ironically, the homes in these areas are typically inexpensive houses with owners living paycheck to paycheck.
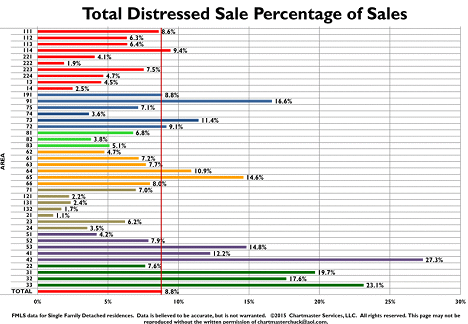
Figure 4: Total Distressed Sales Percentage of Sales per FMLS Area
Now let’s discuss Median Sales Price (Figure 5). To me, this is the most valuable chart of them all. If you are a flipper, doesn’t it make sense to buy and flip below the median sales price of an area? Of course in the northern in town areas like Midtown (23), Buckhead (21), Sandy Springs (131,132) and Dunwoody (121), the median prices are quite high. In these same areas, builders are buying houses to knock down for $350,000 to $500,000 and more.
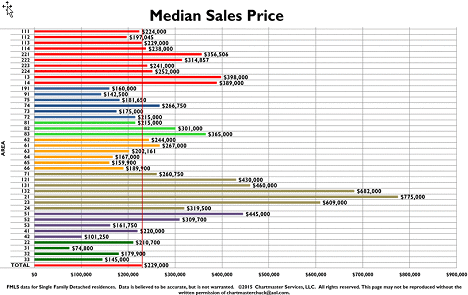
Figure 5: Median Sales Price per FMLS Area
How have median sales prices changed (Figure 6)? The median increase in Metro Atlanta over last year was 6.5%. However, West Atlanta (22) is experiencing tremendous growth now because the housing is relatively inexpensive and because the area is experiencing tremendous improvement due to the construction of the Atlanta Beltway (http://beltline.org/) and the Bellwood Quarry will soon be Atlanta’s newest and largest park.
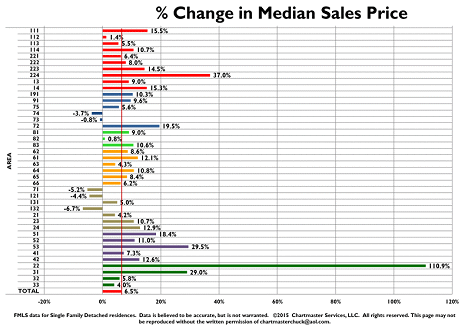
Figure 6: Percent Change in Median Sales Price per FMLS Area
While a balanced market is 6 months of inventory, (almost every area of Atlanta is below that), the median time on market is 3.7 months selling in a median of 56 days. This is great news for rehabbers. In proper condition, priced right, real estate is moving at an unprecedented pace.
While this statistical information was for single family detached, the attached condo – townhouse market are surprisingly similar. Should you need the report, just let me know.
